
June 9, 2017
/

What Robo-Advisors Recommend: An Answer on the Efficient Frontier
Within the last 5 years we have seen a new breed of investment advisors that have been gaining traction. They are online investment platforms known as “robo-advisors”. Some offer investment solutions for individual consumers only, while others offer solutions for businesses and/or other advisors to use them as their investment management solutions.
The investment solutions they offer is based on what is called Modern Portfolio Theory, which uses mathematical algorithms that generate what their investment selection would be, most often using a diversified portfolio of ETF’s.
We decided to test what these Robo-Advisor would recommend for a 65 year old, retired male with a $500,000 portfolio and moderate risk tolerance. The main Robo-Advisors in the industry is Betterment, FutureAdvisor, Schwab Intelligent Portfolio and WealthFront.
Before we show what we found, lets first explain with a little more detail how they execute Modern Portfolio Theory.
Robo-Advisors determine the optimal mix of chosen (whatever they choose) asset classes by solving the “Efficient Frontier” using Mean-Variance Optimization (MVO), the foundation of Modern Portfolio Theory.
The Efficient Frontier represents the portfolios that generate the maximum return for every level of risk. Each portfolio is created by choosing a particular mix of asset classes that maximizes the expected return for a specific level of risk (as measured by variance), or equivalently minimizes the risk for a specific expected return. MVO calculates the best risk-return tradeoff when combining the asset classes in portfolios.
MVO also allows them to evaluate how many asset classes we should use in a portfolio. If adding an asset class to the mix raises the efficient frontier, then it improves the risk-return tradeoff of the portfolios, (i.e. it offers a higher return for the same risk level or lower risk for the same return level).
MVO provides a mathematical framework for evaluating portfolio risk-return tradeoffs.
The basic allocation recommendation is shown in our first Chart
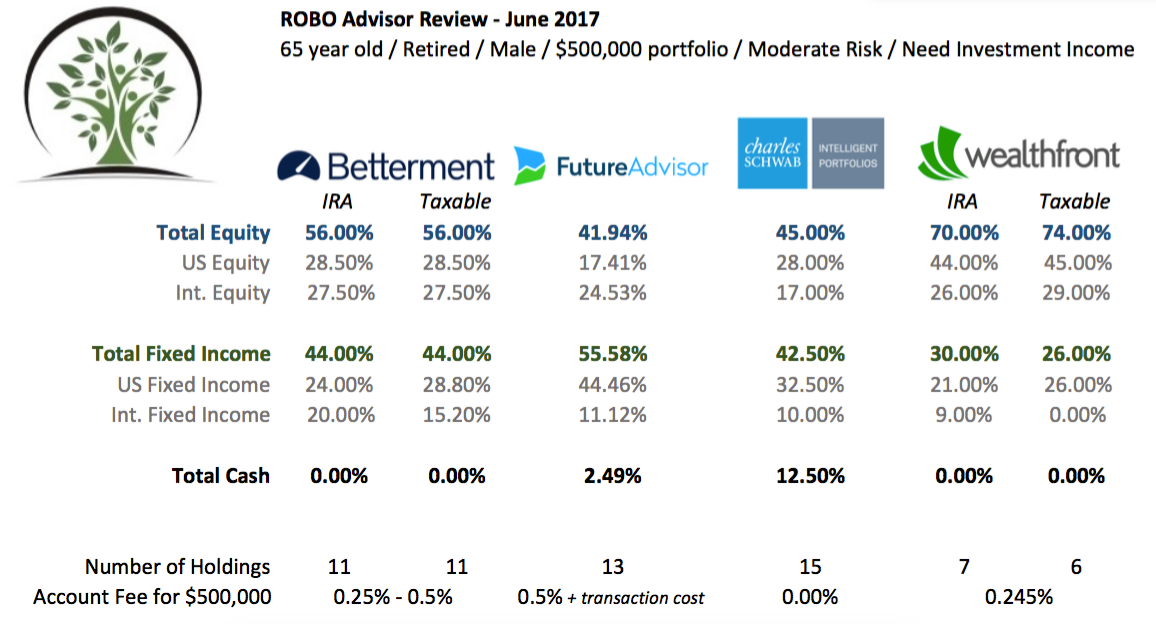
The recommended asset mixes varied significantly as did the level of information the robo-advisors required in order to get a recommendation. Betterment and WealthFront did offer different options for taxable and non-taxable accounts. The number of holdings was relatively close with the exception of WealthFront, which recommended up to 7 holdings compared to the others recommending 11+.
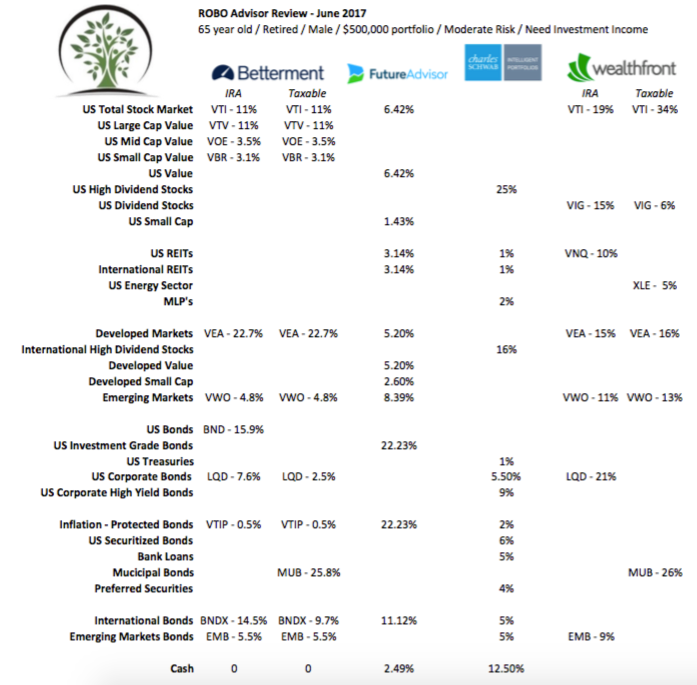
Not only was the asset mixes recommended different for each company, but the percentage allocated to each asset class was even more staggering.
A couple of examples of asset mixes and percentages being different shown in the following chart:
-
Only Schwab recommended preferred securities
-
Future Advisor recommended 22.23% allocated into inflation-protected bonds, next closes was Schwab with 2%
-
WealthFront recommended up to 74% in Equities while FutureAdvisor recommended 41.94%
-
Betterment and Future Advisor equity allocations had a “value” tilt exposure, while Schwab and Wealthfront had a dividend focus
-
Betterment and WealthFront recommended no cash holdings, while Schwab recommended 12.5%
-
Betterment and WealthFront recommended municipal bonds for taxable accounts
As you can see there are huge differences between each companies recommendations.
The one thing that was consistent across all four robo-advisors is none of them told me how much I could expect to earn investing with them. Schwab did give estimated monthly income depending on how long I would expect to need the income.
Why the difference?
So if all four of these companies are operating the same methodology, same mathematical formula, and same research behind their approach why are the recommendations so different?
They are all running the same mathematical formulas with the same asset classes available. Math gives you the same answer every time, 2+2=4 always. So why are the investment solutions so different? The results a 65 year old retired male with a $500,000 portfolio and moderate risk tolerance would be dramatically different between each of these companies over the next 5,10,20 or more years.
The reason why is because there is still a level of decision making and random assumptions inputed by someones(or a groups) viewpoint. Remember I said earlier the efficient frontier displays the best adjusted return for each level of risk. The way to map out the efficient frontier is:
-
Decide which asset classes to use on the map (which may include value vs. growth stocks, dividend vs. non-dividend stocks, etc.)
-
Come up with expected return of each asset class, which can be done one of two ways
i) Use back tested returns to project future expectations
ii) Calculate expected returns using forward looking data (calculated based on assumptions)
-
Come up with expected risk variance of each asset class, which can be done one of two ways
i) Use back tested risk variance to project future expectations
ii) Calculate expected risk variance using forward looking data (calculated based on assumptions)
As most of you already noticed, in order to complete the algorithms there is a lot of behavioral bias and assumptions inputed.
Evergreen Conclusion
Obviously we are more likely to hold a biased viewpoint considering we offer investment management solutions, but this is what we truly believe and is why we are not operating a “Robo-Advisory” firm.
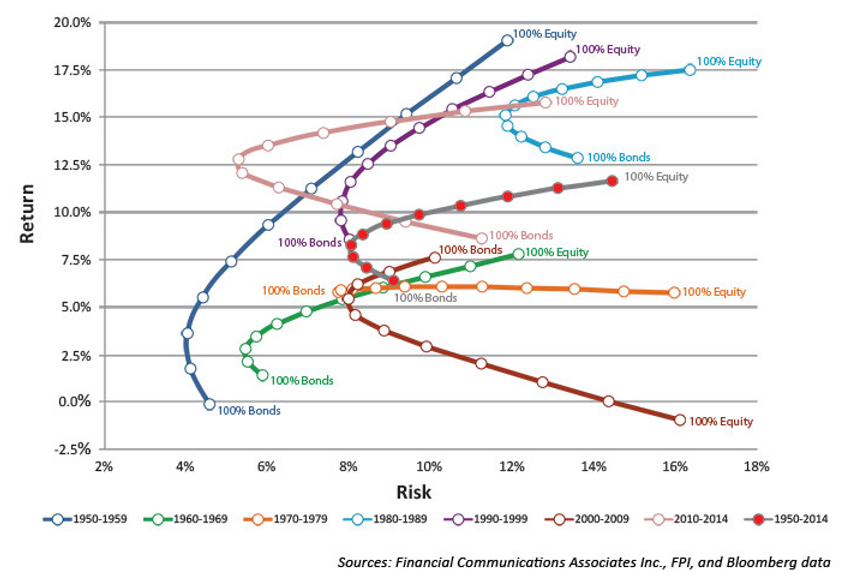
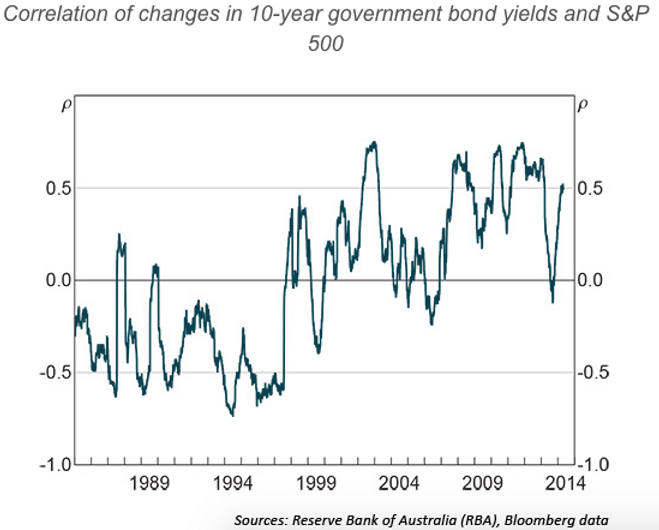
The efficient frontier is simply choosing a good mix of assets to get the most return for the risk you take. Problem is, the future mix is always different than the past. Yes, some things remain the same such as bonds being a great way to reduce risk, but the proper mix is always changing. When you attempt to create a perfect formula for a changing world, the future results will generally underperform expectations. The next two graphs show this; first one showing different Efficient Frontier’s throughout the decades, second showing correlation difference between bonds and stocks over time.
We had a saying in math class when using assumptions or variables, ”Garbage in, Garbage Out”. It means the second we add assumptions we alter results greatly and the output of the formula hinges on assumptions and less on the math formula. If the assumptions are garbage then the math produces garbage. No matter the sophistication of math, it still can produce garbage. Building an efficient frontier counts on our ability to credibly predict asset-class returns, risk and correlation within each asset-class.
Modern Portfolio Theory was a breakthrough in financial theory for ability to clearly show what has happened in the past and give some general guidance for future allocation of resources relative to risk. Using it as a strict formula is a likely way to underperform going forward or expose yourself to backward bias. It can be a very helpful tool when coupled with an overall understanding and management of the market, but we believe very dangerous as a stand alone predictor. Most importantly, it does not consider the actual objectives and changing circumstances of clients such as income needs, estate needs, and specific risk thresholds. An experienced manager can at least error check the assumptions on an ongoing basis and overlay a bit of common sense that has yet to be available using a static program.
What’s good about these advisory firms is that they are more appealing to the younger investor which may get them to start investing sooner rather than later.
Evergreen Wealth Management, LLC is a registered investment adviser. Information presented is for educational purposes only and does not intend to make an offer or solicitation for the sale or purchase of any specific securities, investments, or investment strategies. Investments involve risk and unless otherwise stated, are not guaranteed. Be sure to first consult with a qualified financial adviser and/or tax professional before implementing any strategy discussed herein. Past performance is not indicative of future performance.