
May 4, 2022
/
During the first quarter, 2022 the Wilshire 5000 declined -5.89%(Wilshire 5000 return from 12-31-2021 to 3-31-2022). Over the same period of time the aggregate bond market declined -5.85%.
As of 4/27/22 the correction has worsened with the following as some standard marks year to date:
Equities
- Wilshire 5000: -13.71%
- All Country World Index: -13.10%
- S&P 500: -12.40%
- Nasdaq Composite: -20.16%
- Russell 1000 Growth: -19.62%
- Russell 1000 Value: -5.60%
Bonds
- Barclays Aggregate Bond Index: -8.54%
- Vanguard Short Term Bond Index: -3.98%
- Vanguard Long Term Bond Index: -16.93%
Under the Surface
Within the equity and bond markets we started to see large deviations appear under the surface. Equities dependent on longer term growth in cash flows to justify valuations declined much larger than equities with higher cash flows today. This is evident with the Russell 1000 growth index declining -19.62% YTD compared to only a -5.60% decline for the Russell 1000 value index.
Similarly, we see bonds that depend on longer dated cash flows like the Vanguard long term bond index down -16.93% YTD compared to shorter term bond cash flows like Vanguard short term bond index down -3.98%.
This large adjustment makes sense and is a continuation from the trends we saw manifest at year end. As interest rates continue to climb upwards, we would expect a short-term reversal in valuations. Investments that rely on higher growth rates and cash flows well into the future become less valuable compared to investments stuffing pockets with cash today. A bird in the hand has suddenly become much more valuable than 2 in the bush.
This recent trend runs in stark contrast to the results of 2020/2021 when Mr. Market favored companies that provided a strong story or business that could provide lots of cash flow well into the future at the expense of less cash flows today. This decline amid rising rates and recession fears is a normal and healthy response thus far. In the short term we expect interest rates to drive added volatility; but in the long run (5-10 years) we expect strong business models with solid long-term earnings growth will continue to win out. Just like 2020/2021 gains were the result of a 1-time sugar rush induced by extreme stimulus….so too will 2022 declines be the adjustment to less stimulus and interest rates normalizing. The uncertainty surrounding inflation, rate hikes and recession fears is reaching a high point. In the short run we fully expect the market to price in this uncertainty with a larger decline. However, in the long run we expect that companies and diversified investments with strong earnings power will continue to reward shareholders.
“In the short run, the market is a voting machine but in the long run it is a weighing machine.” – Ben Graham
We remain pleased with the excellent performance of client portfolios. Our goal remains to generate outstanding returns over 10-20 years that meet (and hopefully exceed) client objectives. We have explained in exhaustion the ‘melt up’ that occurred from 2018-2021 as the FED induced an extreme valuation scenario. We avoided chasing the silly high stocks and focus on sustainable business models that can protect and grow earnings for years to come. We warned that a potential outflow of liquidity MUST happen to offset the massive stimulus given. Like a bathtub draining, we are seeing liquidity flow out of the markets at long last. The FED has turned the corner and we no longer expect a ‘melt up’ scenario. Rather we expect the FED to continue and drain liquidity from markets in the following months to harness in the inflationary issues. We have been prepared for this process to unfold and are excited for some of the opportunities that may come from temporary equity price declines. If we can find wonderful companies that produce incredible cash flows at a fair price then we are nothing but benefitted from recent declines. Rest assured, we are opportunity seeking at the moment.
For this quarter I decided to forego the more technical thoughts and focus a little more on the Long View philosophy that we embrace. Not to worry, we have constructed a separate article highlighting deeper thoughts on inflation, interest rates and supply chains that gives a little more insight into the volatility and how we are handling. So, if you want a deeper dive, please click on ,Inflation is Here.
The Long View – Meeting your Desired Outcome
As this market bounces around, it’s important we focus on “The Long View” and meeting your desired outcomes. Countless studies have repeatedly shown, “It’s time in the market, not timing.”
I want you to sit back and imagine the things I ask you to imagine.
First, imagine you are driving down the Interstate. The road is straight. There is very little traffic and conditions are excellent. Imagine you are staring down at the road immediately in front of your hood. Even under these ideal conditions, do you think for a second you can travel in a straight line? Not a chance.
Now imagine looking far down the road. Can you maintain a straight line of travel? Of course, because you are taking “The Long View.”
Now, imagine mowing some grass. What happens if you fixate upon the yard directly in front of your mower as you push it across the long edge of your yard. Do this for a couple strips. Now, look a little bit farther out and push your mower across the long edge of your yard. Do this for another few strips. Compare the straightness of the wheel lines for both methods—“The Long View.”
Doesn’t the same logic apply to investing in the stock market?
I absolutely believe a new decision is made—every day—to leave your money where it is or to move into a different investment or different objective. Moving in and out of investments or changing objectives is the short view. The past 6 months are a great example of this phenomenon. Up until November of last year, more aggressive portfolios had greatly outperformed more balanced and diversified portfolios. Since November, the balanced portfolios have had a huge resurgence and offered significant outperformance over a more aggressive stance. Does this mean you change lanes and swap in and out of ‘risk’ categories? I generally have found ‘risk swapping’ to be counterproductive. About the time you swap into higher risk is exactly when the balanced portfolios will do well…and visa versa. In the long run it is best to pick a sound strategy that meets your plan and stick with it! Clients who have adhered to this advice, stayed content and taken the long view have won big over the past 5-10 years.
The champion investor of all time, Warren Buffet, does not move in and out of things. He holds a clear vision and keeps his eye on “The Long View.” And that’s what we do. We have a set objective, goal, outcome and we focus on that.
Of course nothing is guaranteed either way, but I believe that only with the long view will we maintain our sanity when the market takes a relatively short duration turn against us. Of course we pay attention to the fundamentals. We choose investments we believe are most likely to survive and prosper—and yes, we accept a few defeats here and there when the weather gets rough. We look for opportunity and certainly rotate when warranted. Always keeping our attention on “The Long View.”
Statistics to Support “The Long View”
*Taken from 2014 Crandall & Pierce Study but statistics are still relevant and have held true for today
Below are some key statistics supporting proper asset allocation, long term risk and why it is not prudent to ever time the markets. Not to say we should not rotate to areas with higher value, but this needs done within a proper allocation. We never make short term emotional moves to cash but rather focus on below data and our investment data to guide proper decisions.
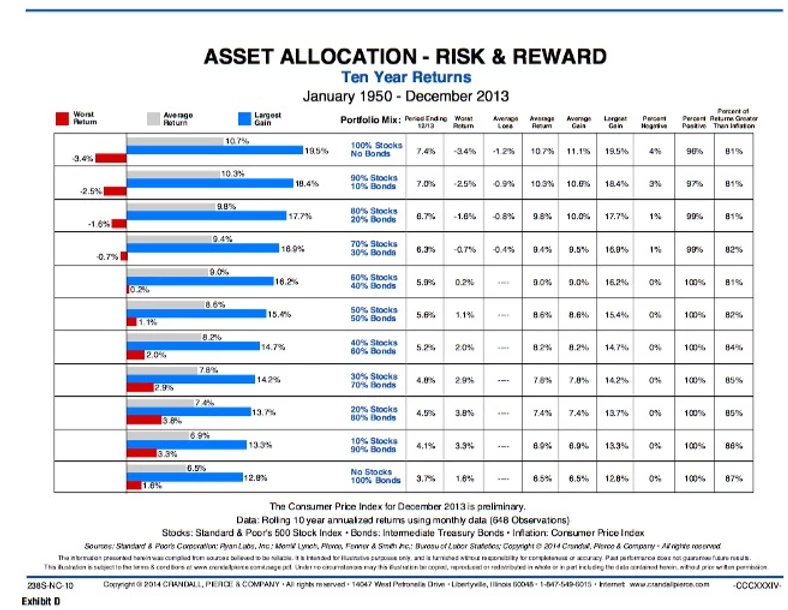
· Historical probability of losing money over any rolling 10 year period with 70% equities / 30% bonds = 1%
· Average Annual Return for a balanced portfolio of 70% equities / 30% bonds over rolling 10 year periods = 9.4% (We do view this as less likely given lower rates today, but still feel 5-7% for moderate and balanced portfolios is realistic)
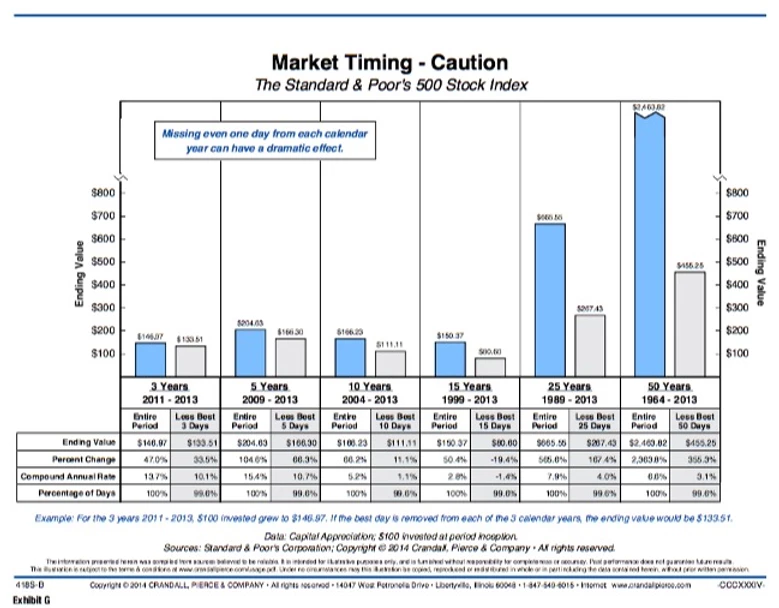
· Missing out on the best 10 market days from 2004-2013 would have changed the S&P 500 return from 5.2% annual average to 1.10% annual average. Timing the market can have deadly consequence on returns!
*Stats taken from charts below.
Summary
“The Long View” has helped Evergreen Wealth deliver on client objectives for decades. Some years we will outperform our goals and other years we will underperform, but we know the long view gives us a very high probability of meeting your desired outcomes.
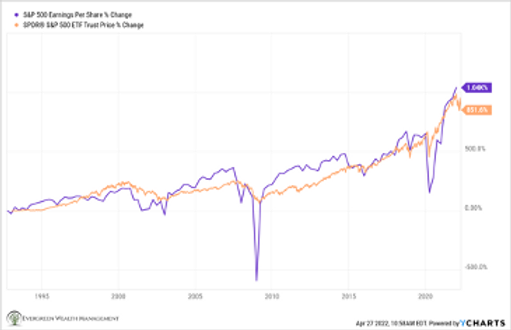
Let me leave you with this final ‘Long View’ thought (highlighted on chart below). Since September of 1992 the Earnings Per Share of the S&P 500 composite has grown by 1,004%. Over the same time, the S&P 500 Price has grown by 852%. $100,000 invested in 1992 would have grown to near $1,000,000..a 10x increase NOT including dividends or dividends re-invested. Imagine taking the dividends and a little principal to live on for 30 years and still seeing your account grow 5-10 times without doing a thing. This is the power of capitalism and the power of Earnings Growth over time.
We have little control over short term market moves BUT our advantage is an ability to analyze each investment to see the long-term direction of earnings power! If we keep owning great companies with great earnings power and hold for a long time….I suspect we will end up just fine. While the street and Mr. Market get short term focused … our competitive advantage is patience and wisdom. Using a longer-term view, remaining unemotional and finding opportunities during declines is a tremendous advantage. For this reason, we are starting to get a little excited about the markets!
*Above chart is an amazing visual for the power of time and Earnings Per Share growth. Embracing this philosophy should greatly help your long term financial journey!
We are grateful for your business and honored to steward your assets, Evergreen has grown primarily through recommendations by clients to their friends and family. We are humbled when we receive a referral and do our best to meet the investment needs of that individual or organization. If you know of someone searching for a trusted adviser with a team of specialist who invest client assets with the same passion and care as they do their own, please let us know. We never take your trust for granted and will treat your referrals with the utmost care and respect.
Disclosures
Index results such as the Wilshire 5000 and S&P 500 do not reflect management fees and expenses and you cannot typically invest in an index.
Evergreen Wealth Management, LLC is a registered investment adviser. Information presented is for educational purposes only and does not intend to make an offer or solicitation for the sale or purchase of any specific securities, investments, or investment strategies. Investments involve risk and unless otherwise stated, are not guaranteed. Be sure to first consult with a qualified financial adviser and/or tax professional before implementing any strategy discussed herein. Past performance is not indicative of future performance.